Demand Response for Data Centers
"I mean, really, how cool is this video? When we produced this in April 2015, we also had no idea how important data centers would be to the grid. And it’s where we learned the term island. The detail of power going out, batteries, coming online, and generators kicking up is also so fantastic from an accuracy and education point of view.
This was created as a sales video, something for the Sales Team to use as a cold open at the beginning of a presentation.
But interestingly, it morphed into more of a hero video on a sales page, and it positioned them as an expert in a very niche space. A space that became incredibly profitable over the years.
The intro is a whole lot of fun too. The question we had was how do we make this look super complicated but kind of inside the logo and what we do — and we had the idea of making it sort of a steam punk type of logo execution inside the container of the logo. "
Pre-Production
Concept & Scripting
This project kicked off with a clear mission: make demand response understandable—especially for a high-stakes audience like data center operators—by blending system logic with visual storytelling. MP2 Energy’s internal brief was focused on showing how proactive power management can reduce infrastructure risk and improve reliability. We approached the explainer as a hybrid: part schematic, part visual metaphor. The end goal was a world that felt engineered but watchable—something that communicated the scale and complexity of a data center without turning into a technical manual.
We started by digging into real-world data center architecture. Floorplans, zoning standards, equipment layouts, redundancy patterns—all of it mattered. That early research gave us the foundation to make sure every space we built would feel right to an industry viewer. We focused our modeling and scripting around mission-critical rooms: server bays, UPS arrays, generator halls, and control clusters. We left out any non-essential office or administrative areas to keep things technical and on-point.
The final script followed a phased logic: reliability infrastructure, event escalation, proactive intervention, and future-state optimization. Each section was tied to a specific environment and visual mechanic—whether that was a power reroute, a dashboard status change, or a spatial transformation. This tight alignment between narration, system behavior, and visual design carried through every phase of production.
Rapid Prototype (RP)
We opened visual development by building the animated MP2 logo—a branded intro that doubled as a metaphor. This wasn’t just a logo spin. Each letter was hollowed out and filled with a mechanical system: rotating gears, LED indicators, wiring lattices, fans, and frame supports. The goal was to turn the logo into a functioning cross-section, symbolizing the engineering depth behind MP2’s work. Behind it, a continuous sinusoidal waveform looped across the frame—referencing energy flow, signal integrity, and grid dynamics. The curve’s rhythm synced with the internal motion, helping tie motion and metaphor together from frame one.
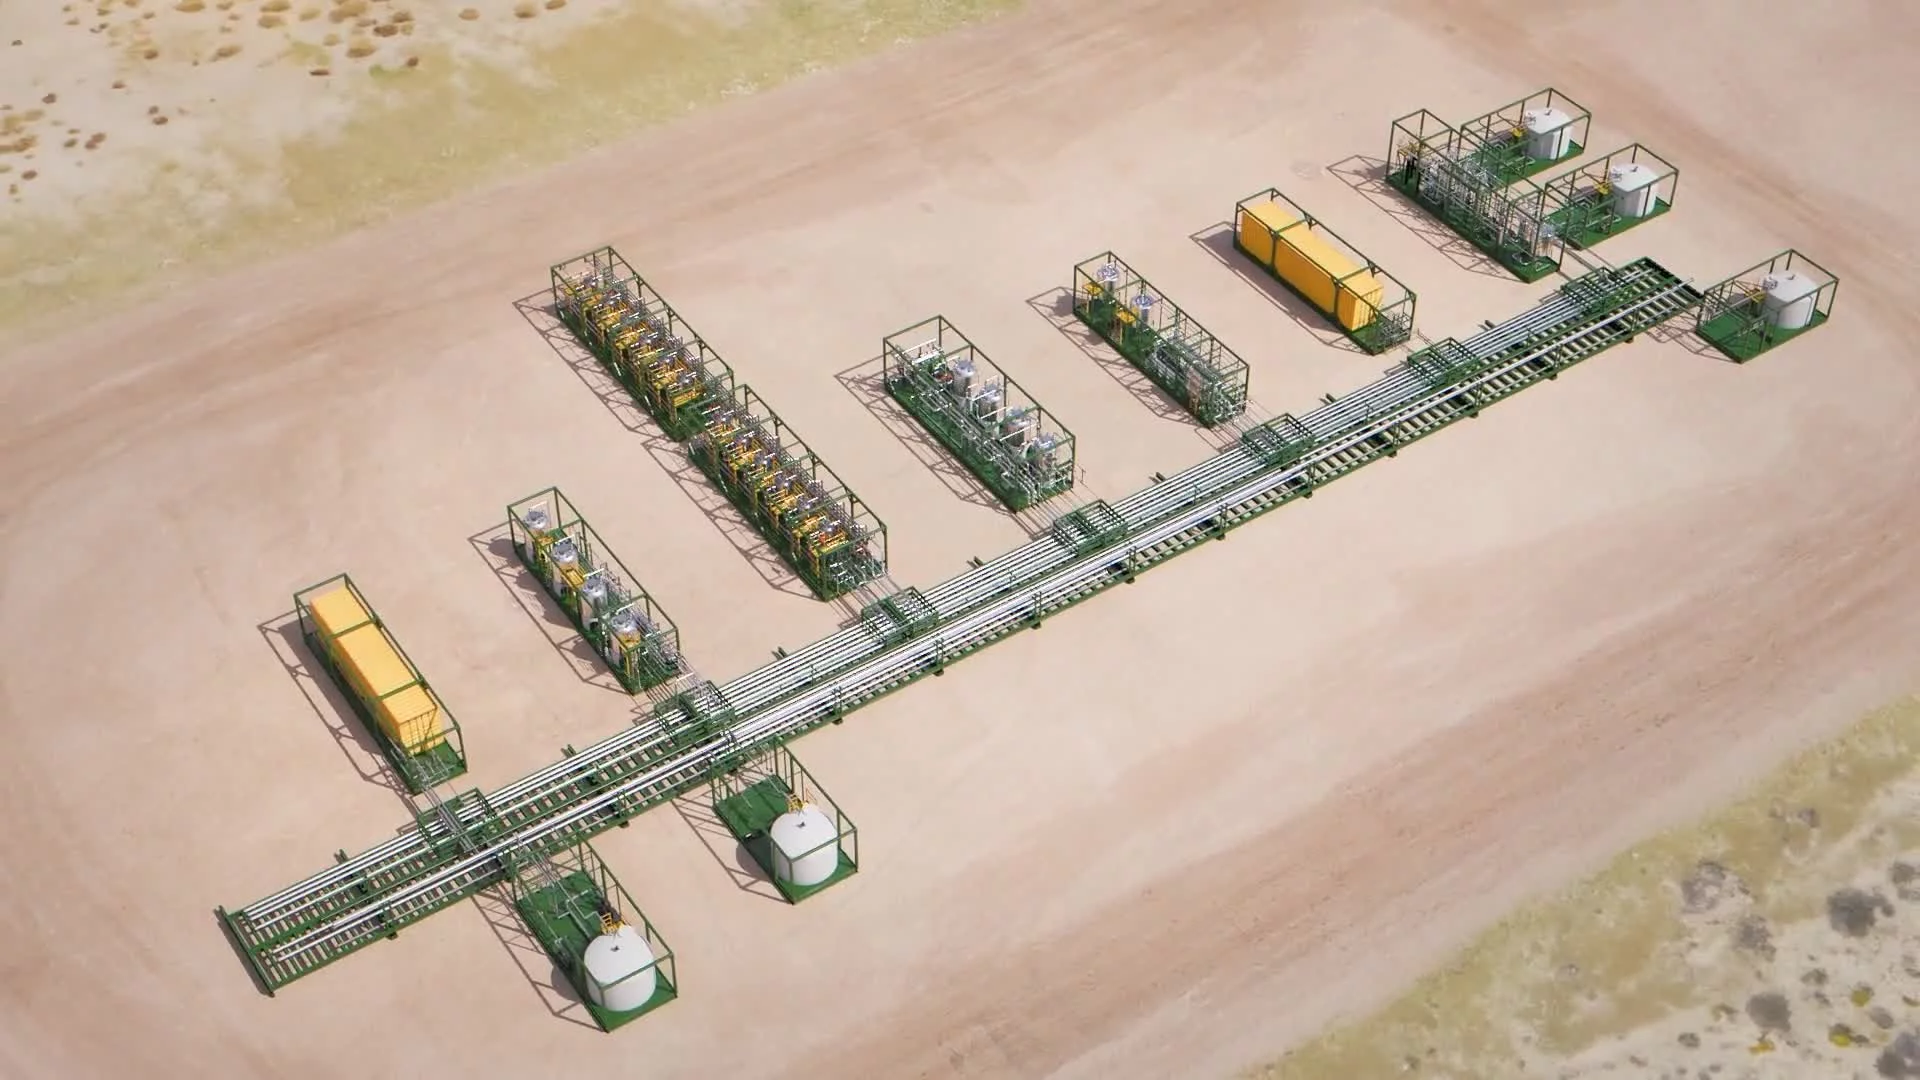
With the logo sequence roughed in, we moved to building the data center model from scratch. Every room was designed from the ground up—based on real compartmentalization practices. Hallways, cooling zones, power blocks, and equipment rooms were all proportioned to real specs. We focused resources on the high-value visuals: server clusters were modular and neatly racked, with cooling systems and walkable side aisles. Generator rooms featured three diesel units wired to wall-mounted switchgear and cable runs. UPS batteries and switches were placed to reflect industry layout logic, especially around physical redundancy and proximity to control systems. Every part of the layout was optimized for camera movement and visual access to the systems we were showcasing.
We then built a macro “systems overview” scene—a stylized world that let us step back and show how the data center connects to everything else. We modeled four separate islands: a power plant array, a residential neighborhood, a high-rise office building, and the data center itself. These islands were laid out on a neutral surface plane and connected with animated spline paths representing transmission routes. Each path would later handle directional power flow with color and speed changes depending on grid state. This macro view gave us a clean way to communicate how distributed systems plug into each other—and how MP2 helps manage the complexity.
Key sequences were rendered as styleframes to help us review composition, scale, and visual logic. These early visuals used placeholder materials and unlit geometry, focused entirely on layout and system clarity. We also built early lookdev passes for internal logo mechanics, dashboards, generator rooms, and energy flow animations. This let us pressure test each subsystem design in isolation before finalizing the full build.
The generator hall took extra iteration. We explored several options—swapping out generator models, shifting switchgear positions, changing room layouts—until the right configuration locked. Once the visual logic was in place, we moved on to camera design.
All shots in RP were animated with early orbital moves, controlled zooms, and progressive push-ins. Every camera move was designed around one principle: reveal the system. Either zoom to expose detail or orbit to show scale. That approach helped us sync camera motion with narrative beats early, which paid off later during timing and pacing adjustments. We closed the RP phase by submitting a complete pass of the animation—placeholder textures, layout-only lighting, and temporary audio—for a full review of structure, timing, and rhythm.
Style Choices and Reasoning
From day one, we chose a visual style that sat deliberately between realism and abstraction. The world had to feel engineered but never overwhelming. We weren’t going for photoreal—we were going for intelligibility. That meant designing a space where complexity looked structured, and technical systems could be explained without distraction.
Modeling detail was focused where it mattered: fans, server chassis, conduit runs, switchgear banks, and mechanical interfaces. Every high-value object had just enough detail to be instantly readable and visually credible. The internals of the MP2 logo were built the same way—busy enough to communicate motion and depth, but not overloaded with micro-detail. Motion was used instead of texture to communicate complexity.
Color was used as a functional tool. Green indicated systems running optimally—clean power flow, stable generation. Yellow showed transitional states or systems under load. Red was used sparingly and only to signal faults, outages, or failure points. These three primary color states were repeated across dashboards, cable paths, and room lighting to build a clear visual system. Blue was reserved for protective overlays—like the proactive forcefield in the final scene—to indicate systemic control and managed response.
Spatial layout was all about readability. The islands weren’t just a design choice—they were a solution. By isolating the power plant, the residential grid, the high-rise, and the data center into separate zones, we were able to visualize each system independently and still show how they connected. It also supported the core message: MP2 brings coherence to complex systems.
Every stylistic decision was built to support clarity. Clean geometry. Purposeful lighting. A measured use of glow and motion. All of it came together to make something technical feel readable. Once this framework was aligned, we moved into Full Production and Post.
Full Production & Post-Production
Look Development
Once layout, pacing, and timing were locked during RP, we shifted into full production—refining every material, lighting setup, and animation pass to match the technical clarity and brand tone expected from MP2. The challenge was clear: make the system feel engineered, readable, and elevated—without veering into visual overload.
The data center environment was our most detailed build. We textured all interior and exterior geometry in Cinema 4D using a clean, intentional material set. Walls, racks, floors, and generator bays were assigned matte, brushed metal, or semi-gloss finishes, chosen to reflect real-world materials while maintaining focus. Emissive details were layered into server racks to simulate LED activity. Generator units were given a warmer metallic surface, set off by floor shadows and overhead cable routing for depth and physical weight.
One of the most important effects we built was the dynamic energy shield. It appears during the failover sequence and carries across the proactive response phase. This visual was driven by a Fresnel-based falloff inside a transparent material, layered with glow and refractive distortions. The shield shifted colors depending on the system state—starting with yellow (UPS activation), transitioning to green (generator handoff), and ending in blue (proactive islanding). These shield states were mirrored in spline cables, dashboards, and room lighting, tying the color logic into every system touchpoint.
Lighting was handled using a single directional source, angled to show form and highlight geometry while keeping contrast soft. Key fill lights were placed surgically to avoid spill between the floating islands, maintaining focus on the data center, residential block, office tower, and power plant array. Shadows were clean, diffuse, and short-fall—supporting the schematic, architectural tone without calling attention to themselves.
Design & Animation
Every camera move from RP was reworked for full production. We kept the logic of orbits, push-ins, and zooms but tightened easing, added focal depth, and synced timing more precisely to narration. When the script described generator resilience, we moved the camera slowly through the bay, revealing system detail and cable routing. When we hit technical terms like “under-frequency relay,” the motion slowed and focused—pointing viewers at the dashboard and spline transitions without breaking pace.
Interior animation followed a deliberate assembly sequence. Each system—walls, battery blocks, server racks—animated into place as the voiceover introduced them. Vertical extrusions and timed drops emphasized construction and control. For example, when the narration said “you have an under-frequency relay,” we animated switchgear blocks into place on the UPS wall. These sequences dramatized complexity without relying on noise or particle effects—just smart motion design synced to voice.
The system dashboard, created in After Effects, became a critical storytelling tool. Built from scratch, the panel featured three core status bars (UPS, Servers, Generators) that updated in real time. During failover moments, these bars changed color and value, reflecting load, priority, and generator status. At key moments, we composited the dashboard directly into the scene.
As the grid stress scenario escalated, we transitioned cable flows from yellow to orange, then red—matched by dashboard indicators peaking into alert states. This color shift was accompanied by animated domes: first the yellow UPS shield, then green generator protection, then the blue proactive overlay. These domes were built with transparency layers, volume masks, and refractive animation to sell the transition from reactive to controlled.
Toward the end, the focus shifted to strategic response. We introduced a conceptual “Procedure Plan” interface—designed and animated entirely in After Effects. Tabs, checklists, and interaction markers appeared through clean UI motion. To connect the concept to the environment, we embedded a “Restoring Power” bar into a 3D frame, tying narrative back to grid status. This sequence supported the final message: MP2 doesn’t just respond—it plans, stabilizes, and optimizes.
VFX Enhancements
Post-production effects were handled in After Effects. We used color correction and curve adjustments to tone the entire sequence cooler—reinforcing MP2’s clean, tech-forward palette. Green, yellow, and red remained locked across every system element, ensuring consistency and legibility. These colors didn’t just signal states—they built confidence in system logic.
For the MP2 logo, we rendered LED emission passes and composited flicker effects and inner glows. This subtle lighting treatment gave the gear-filled logo real visual weight without turning it into a light show. Lens flares were reserved for transitions—dashboard events, shield activations, and intro/outro logo hits. Always clean, always restrained.
ID masks were used throughout to isolate critical elements. For example, during the “redundant generator” segment, we isolated and brightened only the generator units while overlaying capacity metrics. This kind of compositing logic helped the viewer track what mattered most—no wasted attention, no clutter.
The checklist was built and animated with motion blur and texture overlays. Paper-style shading and light drop shadows gave it a semi-tactile feel, anchoring the shift from crisis to procedure. That interface served as a narrative hinge: moving from technical event to long-term control.
Infographics, UI Overlays, and Data Visualization
The dashboard was the core infographic system throughout. It was built to function like a real UX—bars, levels, alerts, and readouts scaled fluidly with the system’s state. Even in wide shots, the dashboard remained legible and spatially accurate. Each bar reflected real-time system changes: server draw, generator activation, UPS capacity.
Later, we introduced 3D bar graphs and visual metrics to convey energy cost and strategic payoff. These bars were animated using spline scaling with bounce easing—adding emphasis during the shift from reactive defense to strategic ROI. It wasn’t just data—it was the value of preparedness visualized in motion.
Brand Consistency
Every frame was aligned with MP2’s visual identity. The animated logo used the same treatment as earlier campaigns—updated with gear motion and light animation for this specific context. Typography, interface design, and iconography followed MP2’s internal specs. Color logic was non-negotiable: green = operational, yellow = transitional, red = critical. This system carried across dashboard panels, spline flows, generator states, and interface feedback.
The consistency didn’t just look polished—it created a visual language that made the system logic easier to follow. No new color codes. No surprises. Just structure.
Delivery
The final video was exported at 1080p in H.264 format, optimized for digital platforms and internal presentations. We also delivered a set of high-res stills capturing key moments: the MP2 logo internals, data center buildout, shield transitions, and macro power system overview. These stills were formatted for slide decks, executive briefings, and campaign support—giving MP2 the assets to extend the story across channels without needing to slice frames manually.
Transcript:
Introducing a better way to manage data center risk with Demand Response. Visit MP2Energy.com/DR for more information.
Reliability. It's at the core of what you do. You've built a data center to deliver exactly that to your customers. You have an under-frequency relay to detect problems in less time than a blink of an eye. You have an uninterruptible power supply and redundant backup generation to protect you when the electrical grid experiences an outage. You've thought through the contingencies, you've trained your staff, and you test your generation, but you still have a problem. Currently, in the case of a real emergency, you expect your redundancy to help you ride through any problems that might occur. Your risk management philosophy is based upon reactive risk management that necessarily entails stressful decision-making when you never have enough time to deal with a fast-developing crisis.
We think there's a better way. Many of the most sophisticated data centers have long recognized that demand response doesn't increase risk. It actually helps decrease it. Demand response gives you advance notice of impending problems on the electrical grid. It gives you valuable time to begin the transition to self-generation.
If you start to island while you still have utility power and something goes wrong. You have more time to correct the problem before the critical loss of power. Proactive response to emergencies increases your ability to safely transition to your own power. There are other benefits as well. The additional curtailment planning to participate in demand response can identify unknown problems in current procedures.
Your demand response participation also helps solve the problem with utility power, shortening the time until reliable utility service is restored. And of course, participating in demand response is a great way to increase your risk management capabilities and lower your energy costs.
Data centers’ inherent redundancy, like battery backup and distributed generation assets, are the perfect fit for demand response.
And remember, participating helps the entire grid's stability. Learn more about demand response for data centers and other viable entities at MP2Energy.com/DR or by calling (832) 510-1030 today.